ECG MASTERY COURSE CONTENT
This course is designed for beginner to intermediate learners and consists of 6 modules. The 1st module provides the foundational knowledge needed to effectively interpret ECGs. The remaining 5 modules focus on the 5 systematic steps of ECG interpretation. We will approach these steps methodically, starting with rhythm analysis (to describe the origin and basic characteristics of the electrical impulse) and progressing from top to bottom, starting with the atria at the top and ending with the ventricles at the bottom.
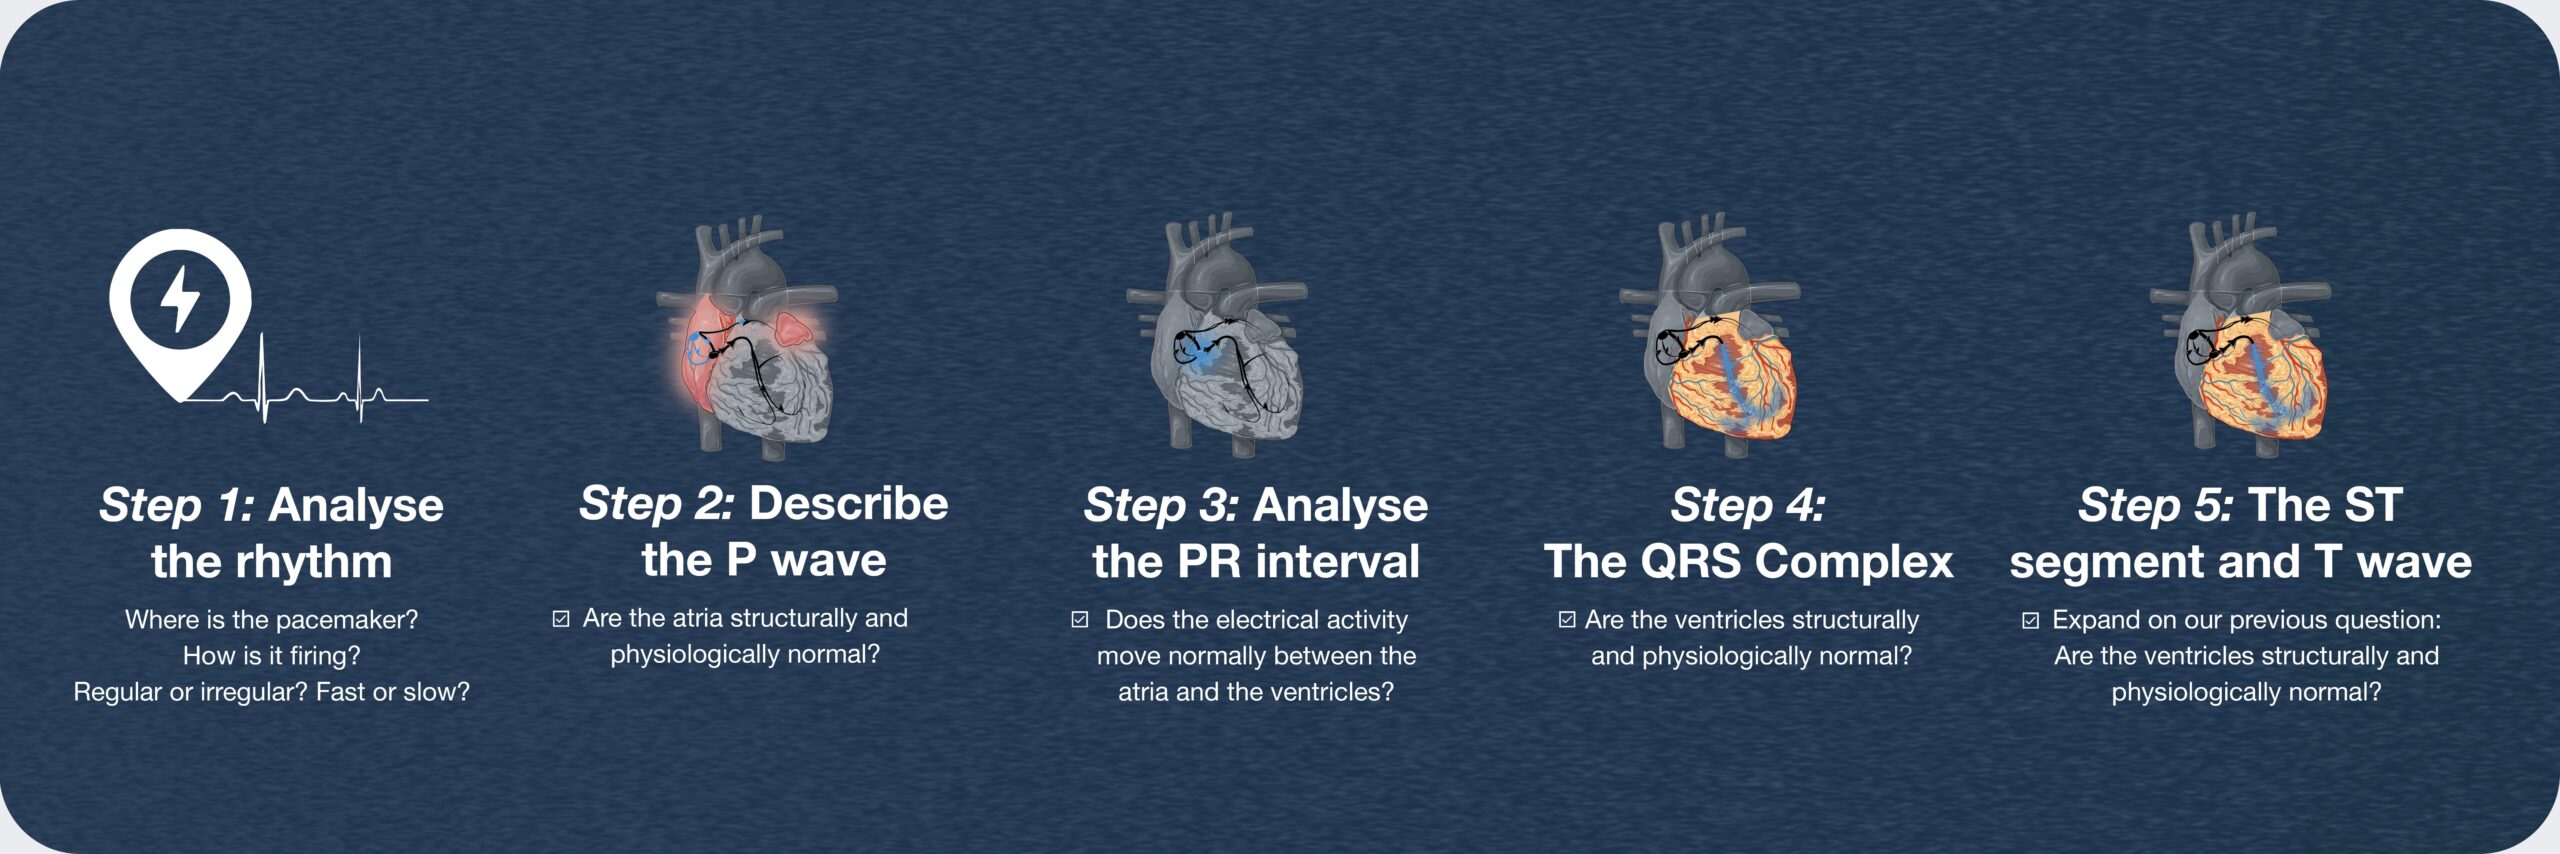
The basic outline of the course is shown below:
- Module 0 – Foundations: A basic understanding of cardiac anatomy and physiology is essential for effectively interpreting and understanding ECGs. This module covers key topics, including cardiac anatomy, the conduction system, the cardiac cycle, the ECG trace, the hexaxial reference system, and ECG paper.
- Module 1 – Step 1 Analysing the rhythm: The heart’s electrical activity must originate somewhere, and rhythm provides critical information about its origin, timing, and frequency. But what exactly is rhythm, and how do we describe it? This module explores these questions and more. You will practice analysing rhythm strips, describing rhythms on an ECG, and understanding the significance of the various elements observed when interpreting rhythm.
- Module 2 – Step 2 Describing the p wave: The p wave represents atrial depolarisation. What information can be gleaned from observing the p wave and what approach should one use when describing it? In this module you will practise how to describe the P wave and how to interpret your findings by looking at some examples.
- Module 3 – Step 3 PR interval: The PR interval essentially describes how the electrical impulse is conducted between atria and ventricles. What is a normal PR interval and what does an abnormal interval suggest? In this module you will learn to describe the PR interval and the PR segment using a systematic approach so that you can successfully answer these questions.
- Module 4 – Step 4 Assessing the QRS complex: The QRS complex represents ventricular depolarisation. By examining the QRS complex, we can identify potential structural or conduction abnormalities within the ventricles. In this module, you will learn how to describe and analyse the QRS complex to detect and understand these abnormalities.
- Module 5 – Step 5 ST segment and T wave: The ST segment and T wave relate to ventricular repolarisation. Similar to the QRS complex, analysing the ST segment and T wave can help identify potential structural or conduction abnormalities within the ventricles. In this module, you will learn how to describe this portion of the ECG trace and recognise common pathologies associated with abnormal ST segments and T waves, such as cardiac ischaemia and infarction.
REQUIREMENTS
There are no formal prerequisites for this course. However, prior knowledge of cardiac anatomy and physiology will be highly beneficial. Core concepts are briefly covered in the foundations module, but if you are entirely new to these topics, the module may not provide sufficient depth. Therefore, we strongly recommend reviewing additional learning resources, some of which will be linked throughout the course.
HOW IS THIS COURSE STRUCTURED?
The course is composed of videos and readings. Questions need to be answered to register that videos and readings have been completed. These questions must be answered correctly to progress to the next section or module. A passing grade of 80% is required to continue.
HOW DO YOU PASS THIS COURSE?
To pass this course learners are required to obtain a minimum grade of 80% on all assessments. All content and assessments need to be completed prior to moving onto the next component of the course.
- Life in the Fast Lane ECG library: https://litfl.com/ecg-library/
- OpenAI. ChatGPT (December 16 version). Used to improve writing and grammar. OpenAI; 2024.https://openai.com